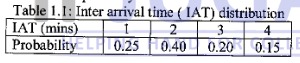
Test whether the 2nd, 9th, 16th........ Numbers in the following sequence are auto correlated by taking  = 0.05. Take
  = 1.96.
0.38, 0.48, 0.36, 0.01, 0.54, 0.34, 0.96, 0.06, 0.61, 0.85, 0.48, 0.86, 0.14, 0.86, 0.89, 0.37,
0.49, 0.60, 0.04, 0.83, 0.42, 0.83, 0.37, 0.21, 0.90, 0.89, 0.91, 0.79, 0.77, 0.99, 0.95, 0.27,
0.41, 0.81, 0.96, 0.31, 0.09, 0.06, 0.23, 0.77, 0.73, 0.47, 0.13, 0.55, 0.11, 0.75, 0.36, 0.25,
0.23, 0.72, 0.60, 0.84, 0.70, 0.30, 0.26, 0.38,0.05,0.19, 0.73, 0.44.


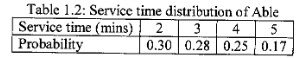
 = 0.05. Take
  = 11.1
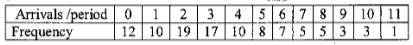
 = 0.25. Random numbers are: 0.073, 0,693, 0.945, 0.739, 0.014, 0.342.
  = 0.05 to determine if the hypothesis that the numbers are uniformly
distributed on the interval [0, 1] can be rejected. Take D
= 0.05 to determine if the hypothesis that the numbers are uniformly
distributed on the interval [0, 1] can be rejected. Take D =0.565.